React/ReactJS: Rendering Highcharts
Highcharts is an excellent charting library developed in JavaScript by Highsoft, a company founded by Torstein Hønsi, who is also the main creator of Highcharts. It was first released in 2009.
Highcharts is capable of rendering various types of graphs, from basic line and column charts to 3D and heatmaps. You can go through all the different kinds of charts supported by Highcharts here.
In this tutorial, we will learn how to use/render Highcharts in ReactJS.

We explore two packages here. Highcharts actually has an officially supported wrapper for React, but we will explore it in the section after the next.
React Highcharts
The package
react-highcharts
came out about a year earlier before the official Highcharts
wrapper. If you wish to use the official wrapper, you can skip this
section and jump to the next.
To use this wrapper, the first step is to install the
react-highcharts
npm package.
npm i react-highcharts --save-dev
After installation, the package will be inside the
node_modules directory. We will create a
separate component to display our charts, say,
Graph.js, and import Highcharts there.
					import React from 'react';
					import Highcharts from 'highcharts';
As an example, let us pick a pie chart and illustrate the
composition of the Earth's atmosphere with it: Nitrogen (78.1%),
Oxygen (20.9%), Argon (0.9%) and Trace Gases (0.1%). We will render
this chart within the
<div> element with id
atmospheric-composition.
					  render() {
					    return (
					    	<div id="atmospheric-composition">
					    	</div>
					    );
					  }
Let us create a state variable, say
series, and assign an array to it
consisting of Earth's atmospheric composition data structured in the
following way inside the constructor().
					constructor(props) {
					    super(props);
					    this.state = {
							series: [{
								  name: 'Gases',
							      data: [
							        {
							          name: 'Argon',
							          y: 0.9,
							          color: '#3498db'
							        },
							        {
							          name: 'Nitrogen',
							          y: 78.1,
							          color: '#9b59b6'
							        },
							        {
							          name: 'Oxygen',
							          y: 20.9,
							          color: '#2ecc71'
							        },
							        {
							          name: 'Trace Gases',
							          y: 0.1,
							          color: '#f1c40f'
							        }
							      ]
							    }]
						}
					}
A Highcharts chart is initialized using the
Highcharts.chart() constructor. The
whole object (within braces) passed as a parameter to it is known as
the options object; and chart,
title and
plotOptions are objects whereas
series is an array. For easy handling,
the Highcharts.chart() constructor is
placed inside the
highChartsRender() function so that we
can just call the function to initialize the constructor. Inside the
chart object, the value
pie corresponding to the
type property indicates that the chart
is a pie chart, and the string value
atmospheric-composition corresponding to
the renderTo property is the id of the
element inside which the chart will be rendered. And to make our pie
chart look like a donut/doughnut, the
innerSize option inside the
pie object of the
plotOptions wrapper object is set to
70%. The last object
series is assigned the state variable
this.state.series, which is an array.
					highChartsRender() {
						Highcharts.chart({
						    chart: {
						      type: 'pie',
						      renderTo: 'atmospheric-composition'
						    },
						    title: {
						      verticalAlign: 'middle',
						      floating: true,
						      text: 'Earth\'s Atmospheric Composition',
						      style: {
						      	fontSize: '10px',
						      }
						    },
						    plotOptions: {
						      pie: {
						      	dataLabels: {
						      		format: '{point.name}: {point.percentage:.1f} %'
						      	},
						        innerSize: '70%'
						      }
						    },
						    series: this.state.series
					  	});
					}
Since we need to render the chart soon after the
Graph.js component is inserted into the
DOM tree, we will be invoking the
highChartsRender() function inside
componentDidMount().
					  componentDidMount() {
					    this.highChartsRender();
					  }
Here is the full code.
					import React from 'react';
					import Highcharts from 'highcharts';

					class Donut extends React.Component {
					    constructor(props) {
					        super(props);
					        this.state = {
					            series: [{
					                name: 'Gases',
					                data: [
					                    {
					                      name: 'Argon',
					                      y: 0.9,
					                      color: '#3498db'
					                    },
					                    {
					                      name: 'Nitrogen',
					                      y: 78.1,
					                      color: '#9b59b6'
					                    },
					                    {
					                      name: 'Oxygen',
					                      y: 20.9,
					                      color: '#2ecc71'
					                    },
					                    {
					                      name: 'Trace Gases',
					                      y: 0.1,
					                      color: '#f1c40f'
					                    }
					                ]
					            }]
					        }
					    }

					    highChartsRender() {
					        Highcharts.chart({
					            chart: {
					              type: 'pie',
					              renderTo: 'atmospheric-composition'
					            },
					            title: {
					              verticalAlign: 'middle',
					              floating: true,
					              text: 'Earth\'s Atmospheric Composition',
					              style: {
					                fontSize: '10px',
					              }
					            },
					            plotOptions: {
					              pie: {
					                dataLabels: {
					                    format: '{point.name}: {point.percentage:.1f} %'
					                },
					                innerSize: '70%'
					              }
					            },
					            series: this.state.series
					        });
					    }

					    componentDidMount() {
					        this.highChartsRender();
					    }

					   	render() {
					       	return (
					            <div id="atmospheric-composition">
					            </div>
					       	);
					   	}
					}

					export default Donut;
Import the Graph.js component inside
your index.js file.
import Graph from './graph';
And finally, render the imported component.
ReactDOM.render(<Graph/>, document.getElementById('root'));
We get our donut chart as below.
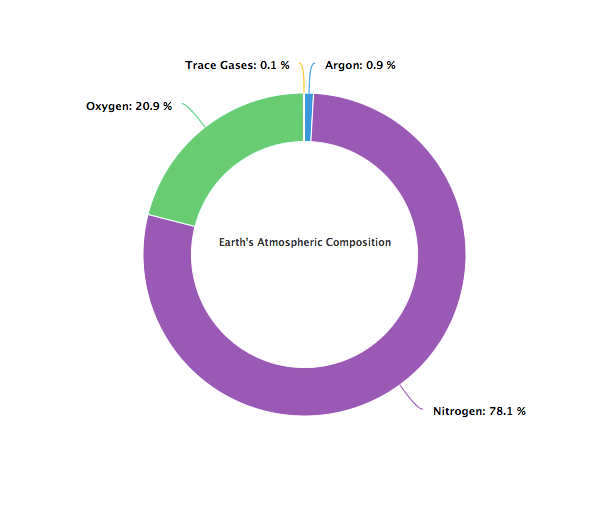 A donut/doughnut chart generated by
Highcharts
A donut/doughnut chart generated by
Highcharts
Highcharts React Wrapper
Now there is also an official Highcharts wrapper for React called
Highcharts React
and it is on NPM:
highcharts-react-official. Install it.
npm i highcharts-react-official --save-dev
Or if you have not installed
highcharts package, you can install it
along.
npm i highcharts highcharts-react-official --save-dev
Import the installed packages into your React component.
						import Highcharts from 'highcharts';
						import HighchartsReact from 'highcharts-react-official';
In this section, we will pick a different chart to plot. We will plot the Vitamin C and Sugar content in the fruits mango, grapes and banana in a stacked bar.
We define a state variable called
barOptions inside the
constructor, which is supposed to
contain chart options.
					constructor(props) {
					    super(props);
					    this.state = {
					      barOptions: []
					    }
					}
We initialize the state variable inside a function called
highChartsRender()
					  highChartsRender = () => {
					    this.setState({
					      barOptions:{
					            chart: {
					                type: 'bar'
					            },
					            title: {
					                text: 'Stacked Bar Chart'
					            },
					            xAxis: {
					                categories: ['Sugar (g/100g)', 'Vitamic C (mg/100g)']
					            },
					            yAxis: {
					                min: 0,
					                title: {
					                    text: ''
					                }
					            },
					            credits: {
					              enabled: false
					            },
					            legend: {
					                reversed: true
					            },
					            plotOptions: {
					                series: {
					                    stacking: 'normal'
					                }
					            },
					            series: [{
					                name: 'Grapes',
					                data: [18.1,33.7],
					                color: '#6f2da8',
					                index: 2
					            }, {
					                name: 'Banana',
					                data: [15.6,9],
					                color: '#ffe135',
					                index: 1
					            }, {
					                name: 'Mango',
					                data: [14.8,14.7],
					                color: '#ff8040',
					                index: 0
					            }]
					        }
					    });
					  }
which is invoked on component load, thereby initializing the state variable.
					  componentDidMount() {
					    this.highChartsRender();
					  }
Now render the default component class exported by the wrapper
inside render() as follows:
					  render() {
					    const { barOptions } = this.state;

					    return (
					      <div>
					        <HighchartsReact highcharts={Highcharts}
					        	options={barOptions} isPureConfig={true} />
					      </div>
					    );
					  }
The generated stacked bar chart is as below:
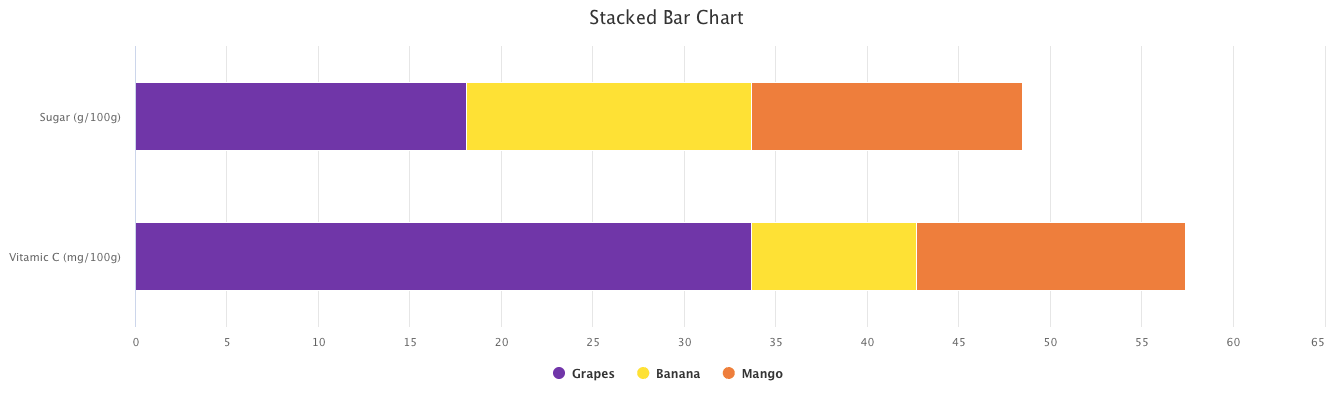 A stacked bar chart generated by
Highcharts
A stacked bar chart generated by
Highcharts