Matplotlib: Plot Sine Function
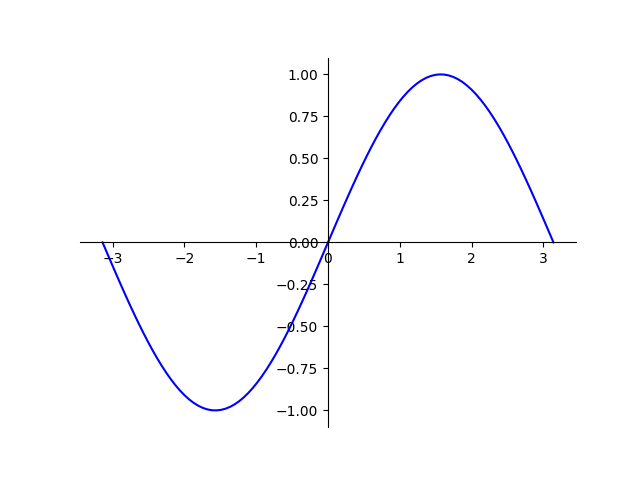
In the Cartesian coordinate system, the trigonometric sine function $\text{sin}(x)$ generates a regular undulating curve, which passes through the origin. Its values range between $-1$ and $1$ for all real values of $x$.
In this tutorial, we will learn how to plot a sine wave in Python w/ Matplotlib. We will be plotting $\text{sin}(x)$ along with its multiple and sub-multiple angles between the interval $-\pi$ and $\pi$.
As the values of $y=\text{sin}(x)$ could surge below till $-1$, the $x$-axis is set to the centre.
Here is the code to generate sine wave in Matplotlib. The graph of $y=\text{sin}(x)$ for $x$ between $-\pi$ and $\pi$.
					import matplotlib.pyplot as plt
					import numpy as np

					# 100 linearly spaced numbers
					x = np.linspace(-np.pi,np.pi,100)

					# the function, which is y = sin(x) here
					y = np.sin(x)

					# setting the axes at the centre
					fig = plt.figure()
					ax = fig.add_subplot(1, 1, 1)
					ax.spines['left'].set_position('center')
					ax.spines['bottom'].set_position('center')
					ax.spines['right'].set_color('none')
					ax.spines['top'].set_color('none')
					ax.xaxis.set_ticks_position('bottom')
					ax.yaxis.set_ticks_position('left')

					# plot the function
					plt.plot(x,y, 'b-')

					# show the plot
					plt.show()

Multiple Angles
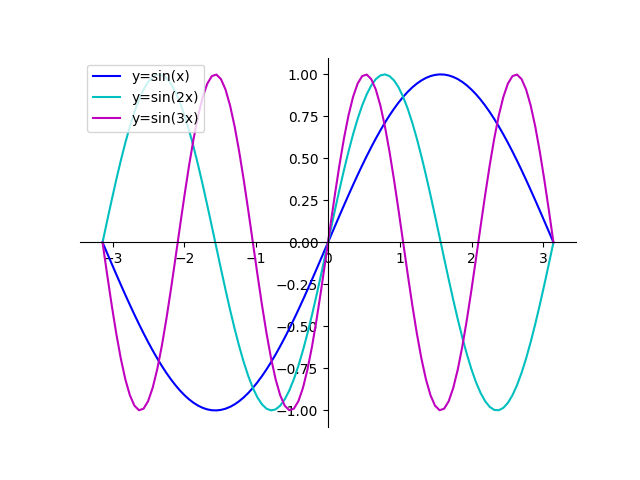
In this section, we plot together the graphs of the multiple angles $y=\text{sin}(x)$, $y=\text{sin}(2x)$ and $y=\text{sin}(3x)$.
						import matplotlib.pyplot as plt
						import numpy as np

						# 100 linearly spaced numbers
						x = np.linspace(-np.pi,np.pi,100)

						p = np.sin(x) # y = sin(x)
						q = np.sin(2*x) # y = sin(2x)
						r = np.sin(3*x) # y = sin(3x)


						# setting the axes at the centre
						fig = plt.figure()
						ax = fig.add_subplot(1, 1, 1)
						ax.spines['left'].set_position('center')
						ax.spines['bottom'].set_position('center')
						ax.spines['right'].set_color('none')
						ax.spines['top'].set_color('none')
						ax.xaxis.set_ticks_position('bottom')
						ax.yaxis.set_ticks_position('left')

						# plot the functions, with labels
						plt.plot(x,p, 'b-', label='y=sin(x)')
						plt.plot(x,q, 'c-', label='y=sin(2x)')
						plt.plot(x,r, 'm-', label='y=sin(3x)')

						plt.legend(loc='upper left')

						# show the plot
						plt.show()

Submultiple Angle
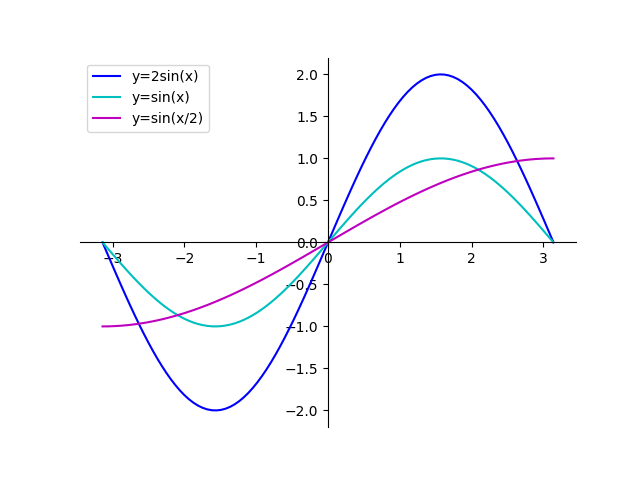
And here we plot together a submultiple angle $y=\text{sin}(\frac{x}{2})$ along with $y=2\text{sin}(x)$ and $y=\text{sin}(x)$.
					import matplotlib.pyplot as plt
					import numpy as np

					# 100 linearly spaced numbers
					x = np.linspace(-np.pi,np.pi,100)

					p = 2*np.sin(x) # y = 2sin(x)
					q = np.sin(x) # y = sin(x)
					r = np.sin(x/2) # y = sin(x/2)
					# setting the axes at the centre
					fig = plt.figure()
					ax = fig.add_subplot(1, 1, 1)
					ax.spines['left'].set_position('center')
					ax.spines['bottom'].set_position('zero')
					ax.spines['right'].set_color('none')
					ax.spines['top'].set_color('none')
					ax.xaxis.set_ticks_position('bottom')
					ax.yaxis.set_ticks_position('left')

					# plot the functions, with labels
					plt.plot(x,p, 'b-', label='y=2sin(x)')
					plt.plot(x,q, 'c-', label='y=sin(x)')
					plt.plot(x,r, 'm-', label='y=sin(x/2)')

					plt.legend(loc='upper left')

					# show the plot
					plt.show()

sin(x)/x
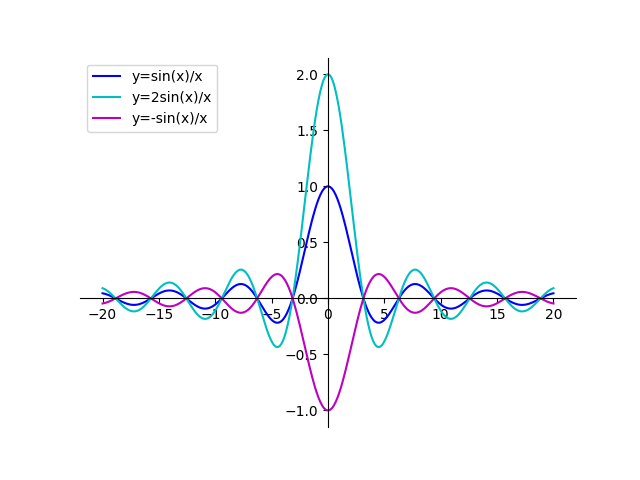
And finally, the illustration of $\text{lim}_{x \to 0} \frac{\text{sin}(x)}{x} = 1$.
						import matplotlib.pyplot as plt
						import numpy as np

						# 100 linearly spaced numbers
						x = np.linspace(-20,20,500)

						y = np.sin(x)/x # y = sin(x)/x

						# setting the axes at the centre
						fig = plt.figure()
						ax = fig.add_subplot(1, 1, 1)
						ax.spines['left'].set_position('center')
						ax.spines['bottom'].set_position('zero')
						ax.spines['right'].set_color('none')
						ax.spines['top'].set_color('none')
						ax.xaxis.set_ticks_position('bottom')
						ax.yaxis.set_ticks_position('left')

						# plot the functions, with labels
						plt.plot(x,y, 'b-', label='y=sin(x)/x')
						plt.plot(x,2*y, 'c-', label='y=2sin(x)/x')
						plt.plot(x,-y, 'm-', label='y=-sin(x)/x')

						plt.legend(loc='upper left')

						# show the plot
						plt.show()
