Matplotlib: Subplot
In this tutorial, you will learn how to add multiple subplots to a figure using Matplotlib's subplot() function.
The syntax is as follows
subplot(rows,columns,index,**keyword)
where the first two parameters rows and columns indicate the number of rows and columns of a grid. The index position starts at 1 in the upper left corner and increases to the right. The last parameter **keyword are comma-separated arguments for the returned Axes base class.
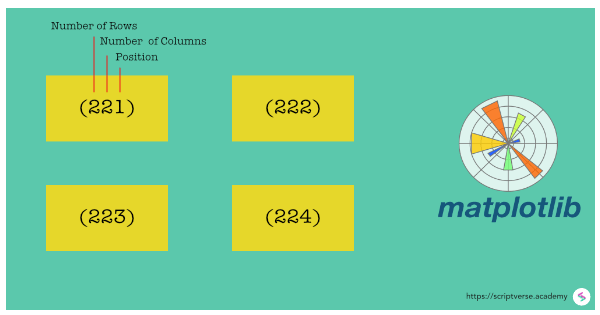
The other way to indicate position is just to combine the rows, columns and index parameters as a 3-digit integer, stripping off the commas.
subplot(pos,**keyword)
And lastly, each subplot can also be assigned to some variable, say, ax, and that assigned subplot ax can be added to the figure. Here is the syntax:
subplot(ax)
Next, we will first create two subplots in a figure.
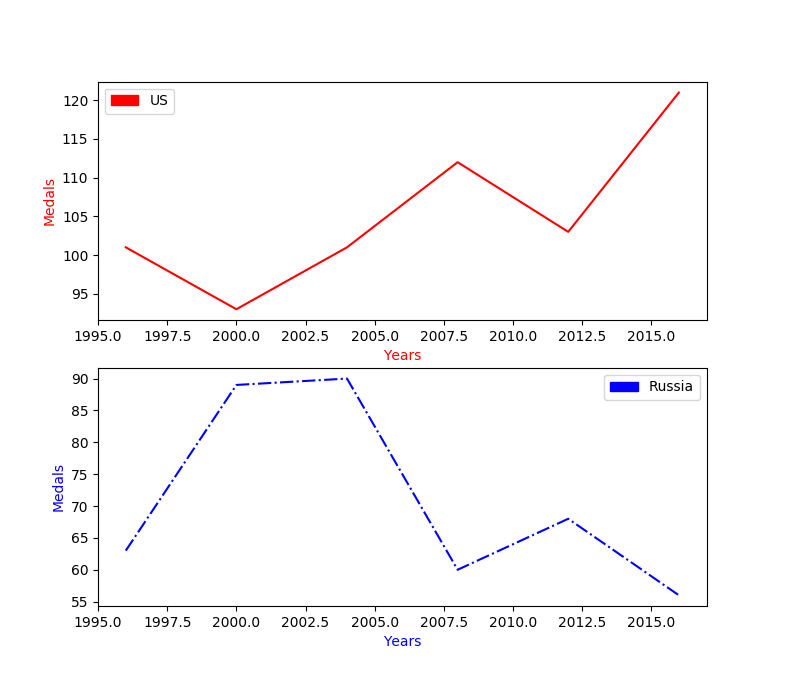
Two Subplots in a Figure
For this, we consider the number of medals won by two countries (one for each subplot), the US and Russia, in the Summer Olympics between the years 1996 and 2016 to plot. The details will be presented as two subplots in a single figure. Here is the Python script. We use the second syntax for subplot(), where the number of rows, number of colums and the index of the subplot are represented as a 3-digit integer.
						import matplotlib.pyplot as plt
						import matplotlib.patches as mpatches
						years = [1996,2000,2004,2008,2012,2016]
						us = [101,93,101,112,103,121]
						russia = [63,89,90,60,68,56]

						plt.subplot(211)
						plt.plot(years,us,'r-')
						plt.xlabel('Years', color='#ff0000')
						plt.ylabel('Medals', color='#ff0000')
						us_legend = mpatches.Patch(color='red', label='US')
						plt.legend(handles=[us_legend])

						plt.subplot(212)
						plt.plot(years,russia,'b-.')
						plt.xlabel('Years', color='#0000ff')
						plt.ylabel('Medals', color='#0000ff')
						russia_legend = mpatches.Patch(color='blue', label='Russia')
						plt.legend(handles=[russia_legend])

						plt.show()
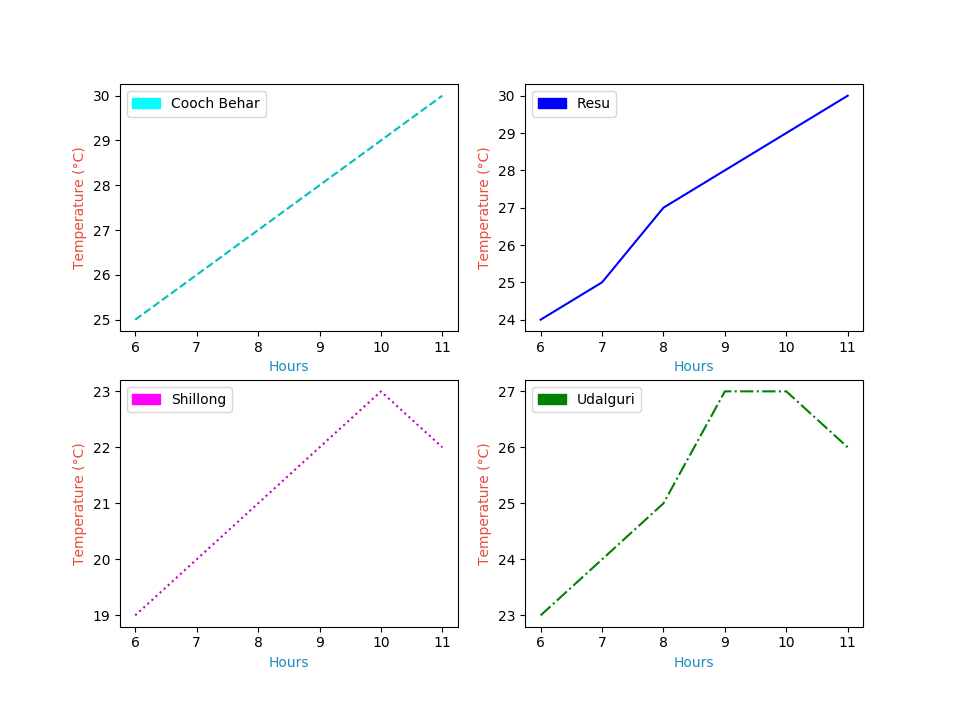
Four Subplots in a Figure
We will now plot four subplots in a figure. We consider the temperatures (in °celsius) of a typical Autumn morning from 6 AM to 11 AM, in the four towns of Cooch Behar, Resu, Shillong and Udalguri.
					import matplotlib.pyplot as plt
					import matplotlib.patches as mpatches
					hours = [6,7,8,9,10,11]
					coochbehar = [25,26,27,28,29,30]
					resu = [24,25,27,28,29,30]
					shillong = [19,20,21,22,23,22]
					udalguri = [23,24,25,27,27,26]

					plt.subplot(221)
					plt.plot(hours,coochbehar,'c--')
					plt.xlabel('Hours', color='#1e8bc3')
					plt.ylabel('Temperature (°C)', color='#e74c3c')
					coochbehar_legend = mpatches.Patch(color='cyan', label='Cooch Behar')
					plt.legend(handles=[coochbehar_legend])

					plt.subplot(222)
					plt.plot(hours,resu,'b-')
					plt.xlabel('Hours', color='#1e8bc3')
					plt.ylabel('Temperature (°C)', color='#e74c3c')
					resu_legend = mpatches.Patch(color='blue', label='Resu')
					plt.legend(handles=[resu_legend])

					plt.subplot(223)
					plt.plot(hours,shillong,'m:')
					plt.xlabel('Hours', color='#1e8bc3')
					plt.ylabel('Temperature (°C)', color='#e74c3c')
					shillong_legend = mpatches.Patch(color='magenta', label='Shillong')
					plt.legend(handles=[shillong_legend])

					plt.subplot(224)
					plt.plot(hours,udalguri,'g-.')
					plt.xlabel('Hours', color='#1e8bc3')
					plt.ylabel('Temperature (°C)', color='#e74c3c')
					udalguri_legend = mpatches.Patch(color='green', label='Udalguri')
					plt.legend(handles=[udalguri_legend])

					plt.show()